Making Sense

Finding the Greatest Product – 5th Grade Students

This is a lesson from several years ago, that I borrowed from a post from Fawn Nguyen.  Her blog post describing how she used it is excellent!

In this lesson, students are given 5 digits and their goal is to find the greatest product without actually doing the computation. The fifth grade students I used this with loved it. We took two days – one day to introduce the problem and a second day to try it again with different numbers, and find patterns. This is a fantastic problem because of the connections to so much more than place value!  

Day 1

I started out with the same numbers Ms. Nguyen used in her example on her post.  I did this because of time constraints on the first day. PTO performance dress rehearsals can really mess up a plan!

So the students were given the digits 8, 2, 4, 5, and 7. The task was to create two factors that would give the greatest product without actually doing the multiplication.

I asked students to take 90 seconds to think about it, then share their ideas with their groups.  The math discussions were incredible.  “582 x 47″ is less than hers because 582 x 74 has to be bigger.  That one has only 47 groups of 582.  This one has 74 groups of 582!”  Similar comments/discussions happened at each table.

The students then shared their ideas for the two factors that would make the greatest product as I wrote them on the board:

582 x 74 =                                      782 x 54 =                                      872 x 45 =


825 x 74 =                                      752 x 48 =                                      752 x 84 =


                        754 x 82 =                                      572 x 84 =

I asked students to look carefully at their list and discuss with their tables which two they think should be removed and why. I did remind students that they should base their decisions on mathematical reasoning, not computation.

After about 90 seconds of discussion, I asked each table to identify the problem they think should go. After two tables shared, everyone agreed that these two (in red) should go.

582 x 74 =                                      782 x 54 =                                      872 x 45 =


825 x 74 =                                      752 x 48 =                                      752 x 84 =


                        754 x 82 =                                      572 x 84 =

The students’ reasoning ranged from rounding to doubling and halving to just finding one more on the list that had to be greater. After that, students had to decide from the 6 left, which one would produce the greatest product. Most groups eliminated 2 or 3 more, but they struggled to find 1 because they thought it could go either way (see the green problems above).

Again, due to time constraints and PTO rehearsals, I asked them to choose one. The classroom teacher who was observing, had already found the products of all of the problems on the board.  We asked for the products and wrote them on the board to some cheers of “Yes!” and some groans of “No!”

All agreed that it was a fun exercise. I loved it because the students were engaged in several of the mathematical practices, specifically constructing viable arguments and critiquing the reasoning of others This happens in other lessons, for sure, but it seemed more natural here because the disagreement was based on the reasoning used. Since not all students think the same way (and they shouldn’t), there were natural mathematical arguments discussions.

Before I left the classroom, I pulled out my deck of cards and had 5 students choose a number card to generate 5 new digits so that when they finished their PTO performance later in the evening, they could think some more about the math we did in class today.  They were asked to come up with a 3-digit factor and a two digit factor that they think would give the greatest product.

Day 2

The next day, we went through the same process (the previous day’s work was on the board for them to refer to).  The numbers the students drew were: 2, 9, 6, 7, 8

There were 12 ideas for the greatest product this time.

892 x 76 =                                      782 x 96 =                                      982 x 76 =


987 x 62 =                                      267 x 89 =                                      762 x 98 =


769 x 82 =                                      862 x 97 =                                      872 x 96 =


872 x 69 =                                      972 x 86 =                                      962 x 87 =

Again, I asked them to think for 90 seconds on their own, then share their thoughts with their tables about which problems could be eliminated based on mathematical reasoning.  After sharing, I asked each table for their thoughts about which should go and why.

Again, the reasoning was amazing. The class, as a whole, came up with reasoning to eliminate 8 of the 12. They’re shown below in red.

892 x 76 =                                      782 x 96 =                                      982 x 76 =


987 x 62 =                                      267 x 89 =                                      762 x 98 =


769 x 82 =                                      862 x 97 =                                      872 x 96 =


872 x 69 =                                      972 x 86 =                                      962 x 87 =

The class got into a discussion about which of the remaining should go without prompting because they were so engaged in this problem! The class could not decide, but it was pretty well split between the green problems above.

Some thought it was 862 x 97 because:

  • “It’s almost 100 groups of 862 and 872 x 96 has one less group of a smaller number, but it isn’t enough.”

The other group countered with:

  • “We still have almost 100 groups of a larger number.  We have one less group, but we have 10 more in each group!”

Again, the teacher was ready with the products and we checked all of the eliminated problems first to justify their earlier reasoning.  We heard a few things that really made these two days worth it like: “See, I told you it was about 27,000” and “We were right get rid of that one!”  Makes your heart swell up when kids say those things with mathematical confidence!

When we got down to the final two, they were on the edge of their seats! As the final products were revealed, there were no “I told you so’s” or mocking of others. The students really enjoyed the productive struggle of thinking and reasoning about greatest products. The students had a great time, but it wasn’t over yet.

As some in Queen Nguyen’s class, one student noticed a pattern from the work of both days.  His explanation is described below:

“I noticed in both problems that the 2 was in the same place (red underline) and that it’s the smallest of the digits we used, so I thought about the largest numbers (digits) and checked to see if they’re in the same place and they are (Blue underline)!”

Another student chimed in with “There’s more. Look, the greatest digit is in the tens place for the second number. The next greatest digit for the first problem is 8 (green underline) and it’s in the hundreds place. For the second problem, the next greatest digit is 7 (green underline) and it’s in the hundreds place, too! And the third? greatest digit is right next to that in the tens place of the first number. And the digit before the smallest is in the ones place of the second number.”

The students were eager to check another set of numbers to see if this pattern they found could actually be a mathematical discovery. They wanted 5 more digits to use to check – they were asking to do more math! Before they left for the day, I found out that some students wondered if the pattern would change if it was a 4 digit times a 3 digit. Guess we’ll have to do another exploration!

All of this stemmed from asking students to reason about multiplication. In the process, all of their ideas were used to build a deeper understanding of multiplication and estimation. As a result, they made an interesting mathematical discovery based on the patterns they discovered and posed a new question to explore!

Thanks, again, to Fawn Nguyen for sharing this problem!
I Didn’t Know What I Didn’t Know…

Let me just start with this.  If you live in Georgia, say within a 2 hour drive to the UGA Griffin campus, seriously consider joining the Masters’ or EdS program.  I’m in my first semester.  It’s amazing!  ‘Nuff said.

Maybe it’s just me… I thought I understood everything I needed to know about fraction equivalence… until this week.  If you get to the end and think, “Oh, I already knew that!” I apologize.  This is post is really for me to reflect a bit.  If it helps anyone else make sense of fractions…well that’s just gravy!

It all started with an assignment for one of my graduate classes. The assignment was to read Chapter 3 from Number Talks Fractions, Decimals, and Percents by Sherry Parrish and reflect on one of the big ideas and the common misconceptions connected to those big ideas.  I chose to reflect on fraction equivalence.

In the section on equivalence, Dr. Parrish talks about how students want to take fractions like 1/4 and multiply by two to get an equivalent fraction of 2/8. This misconception may be fostered by teachers who wish to make equivalent fractions easy for their students to remember. This is never a good idea!  Because really… if you multiply 1/4 by two, that means you have 2 groups of 1/4.  And 2 groups of 1/4 gives you 2/4 and 1/4 can’t be the same as 2/4.

What I learned next came from a phone conversation I had with Graham Fletcher about 15 seconds after I finished reading the chapter.  Sometimes I just think he knows when I’m learning some math and gives me a call.  He had a question about equivalent fractions. Over the course of about 45 minutes talking on the phone, I think we both deepened our understandings about what makes two fractions equivalent.

Take the rule of multiplying the numerator and the denominator both by the same number to make an equivalent fraction.  If we look at 1/4 and multiply the numerator and denominator by two to get 2/8, we get an equivalent fraction, but this isn’t necessarily the whole story.  To really understand fraction equivalence, I had to be asked to dive a little deeper. Graham asked me to dive deeper.  As we talked, multiplying by one came up, then the multiplicative identity.  These ideas definitely strengthened my understanding of fraction equivalence.

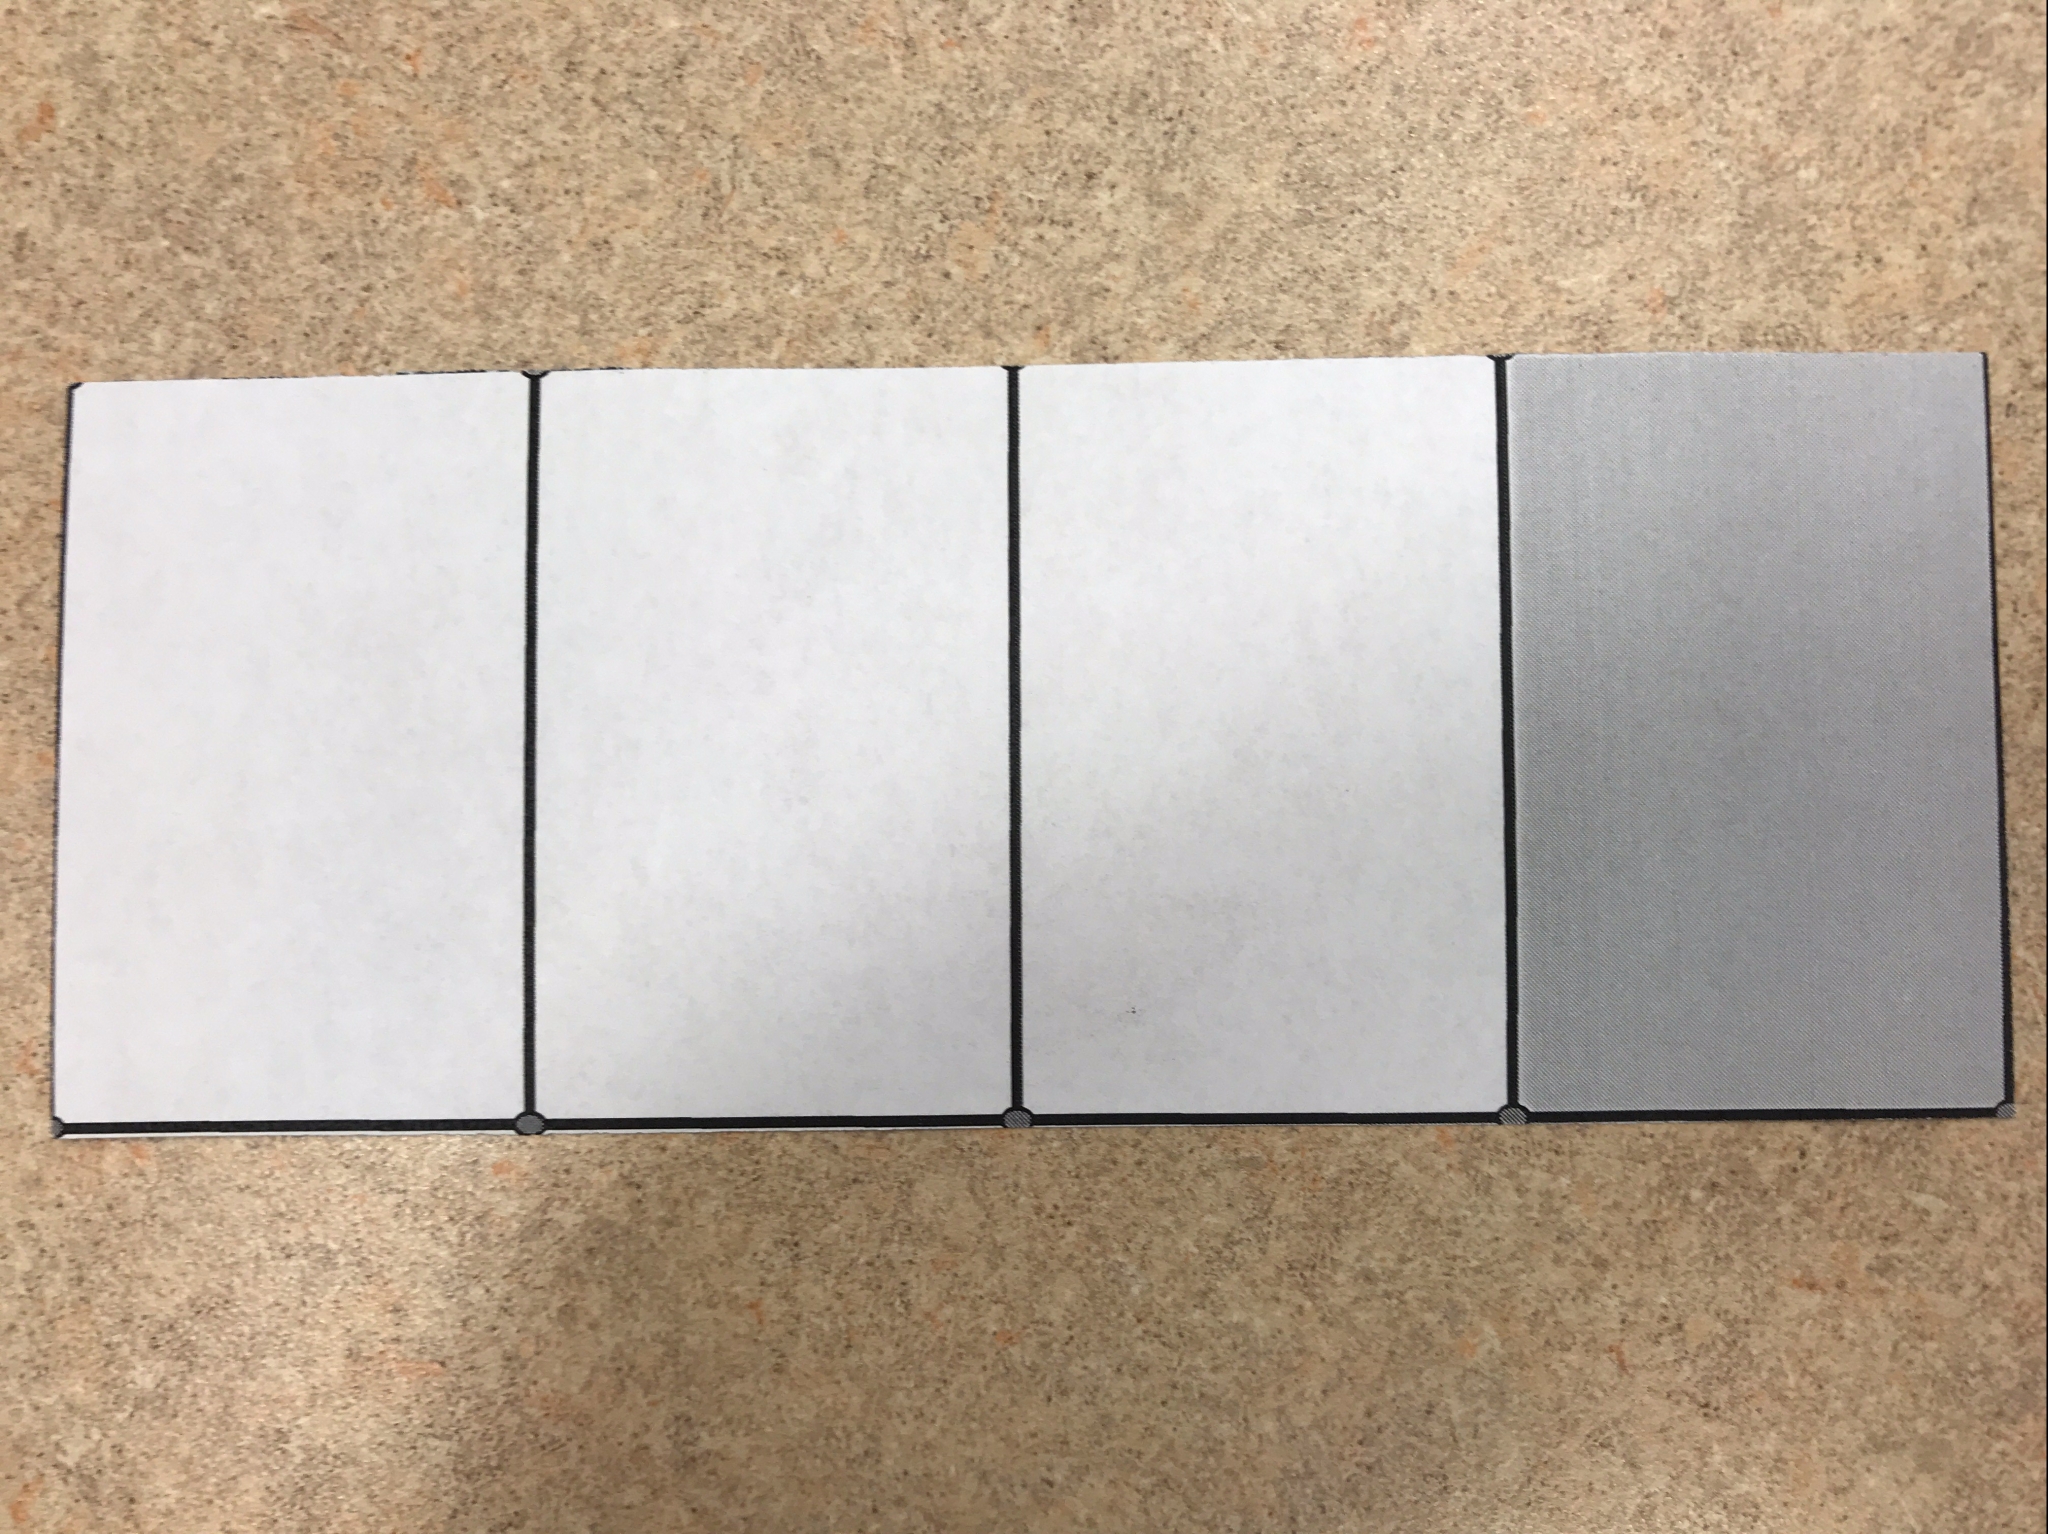
I thought I now had a deep understanding of fraction equivalence.  But wait, there’s more.  This is the best part.  I went to class this past Saturday and Dr. Robyn Ovrick gave us this:

IMG_9381

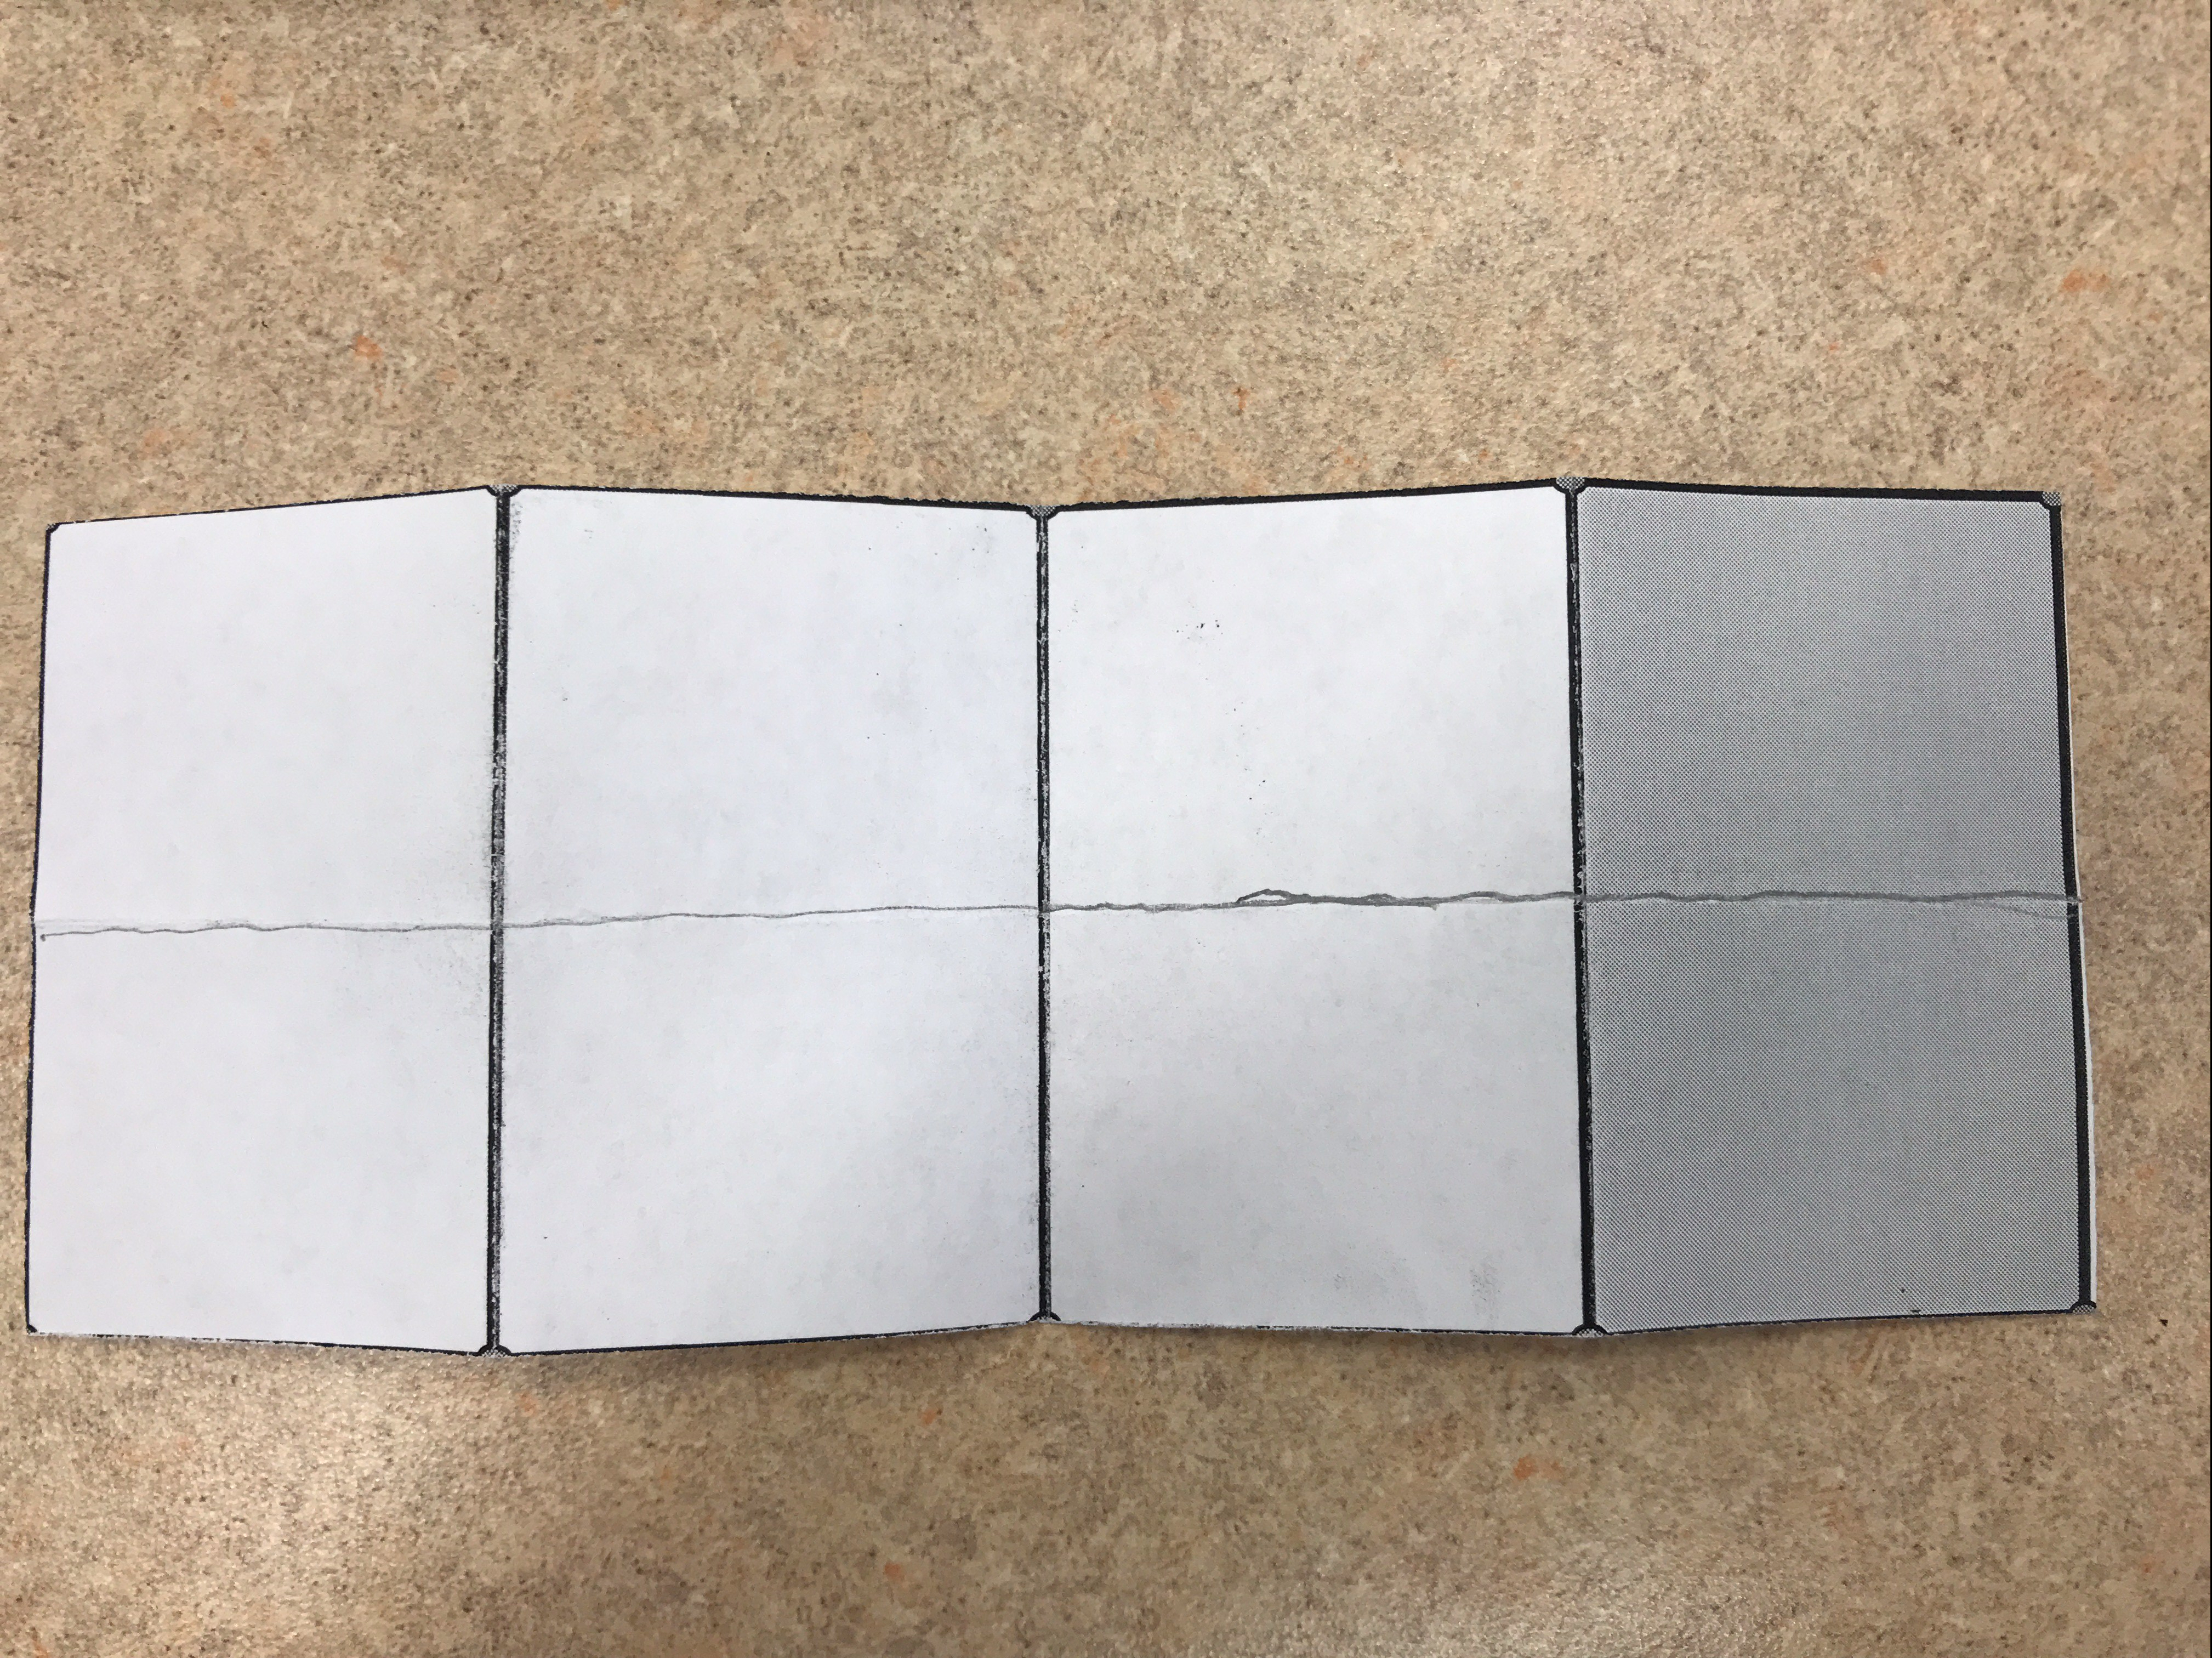
We were asked to fold the paper as many times as we wanted as long as all of the sections were the same size.  Some of us folded once (guilty – I hate folding almost as much as I hate cutting).  We shared our folds and Robyn recorded what several of us did on the smart board.  Then she asked what we noticed.  This is where everything came together for me.  I tried to share my thoughts but I don’t think I was very successful.  I was really excited about this.  Here is my (1 fold) representation of an equivalent fraction for 1/4:

IMG_8970

For my example, someone said the number of pieces doubled, and at this point (my eyes probably almost shot out of my head) I thought, but the size of the pieces are half as big.  I’m usually pretty reserved and quiet, but this was too much.  So, with a lot of help from colleagues in class who know me a bit better than the others it all came clear to me.  We visually made equivalent fractions, but connected the visual to the multiplicative identity and even explained it in the context of paper folding.

Here it is.

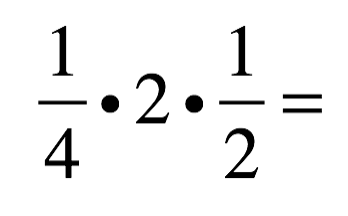
The original paper shows 1/4.  When we fold it in half horizontally, we get 2 times as many pieces and the pieces are half the size.  This can be represented here:

Screen Shot 2017-10-08 at 8.22.03 PM

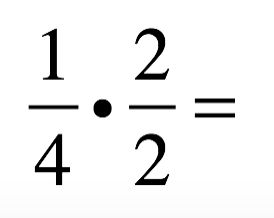
The 1/4 represents the original fraction. The 2 shows that we got twice as many pieces, and the 1/2 shows that each of those pieces is half the size.  With a little multiplication and the commutative property we can get something that looks like this:

Screen Shot 2017-10-08 at 8.26.14 PM

Knowing that two halves is one whole is definitely part of this understanding, but seeing where it can come from in the context of paper folding allows an opportunity for a much deeper understanding. The numerator tells that there are twice as many sections as before and the denominator (really the fraction 1/2) says that the pieces are now half the size.  We looked at another example of how someone folded 1/4 (someone who folded 8 times!) and noticed that it worked the similarly – we got 8 times as many pieces and the pieces were each 1/8 the size of the original.  I don’t think anyone thought it wouldn’t work similarly, but it sure is nice to see your ideas validate something you thought you really understood before waking up that morning!

I’m still thinking about this and I keep making more connections.  This morning, in a place where I think I do my best thinking (the shower!), I realized that this is connected to the strategy of doubling and halving for multiplication.  I’ll leave you with that.  Time for you to chew.


Unlikely Students in Unknown Places

I recently got back from Santa Fe.  I was attending a conference there for a few days last week and afterward, I drove to El Paso to visit my brother’s family (he’s currently stationed in the middle east so I didn’t get to see him – unless you count face time) for a day before flying home.

Let me preface this story by saying that we all probably have a story similar this, but how we handle it can be a possible game changer.

Somewhere on my long drive, I stopped at a fast food restaurant to grab a quick bite.  So, I went inside and got in line.  The following outlines the beginning of our interaction as I stepped to the counter:

Cashier:  May I take your order?

Me:  Yes, please.  I’d like a number 2.

Cashier:  Large or medium.

Me:  Medium, please.

Cashier:  (after pushing more buttons than is conceivably necessary to enter my choice of “medium”): Your total will be $6.05.

I dug through my wallet (receipts from the trip and everything) and found that all I had was a $10 bill, so I handed it to her.  She entered $10.00 correctly and the correct change of $3.95 showed up on the little screen.  At just about that point, I remembered that I had a bunch of change in my pocket and said quite enthusiastically, “Oh, wait, I think I have a nickel.”  Who wants to carry around $0.95 in change in their pocket.

The cashier didn’t miss a beat, and said, “So, your change will be $4.00 even.”  I kind of smiled as I continued to look through my change, proud that she had a mental strategy to adjust to the situation and that she seemed quite confident and comfortable using it in this situation.

Unfortunately, I didn’t have a nickel, but I still didn’t want change falling out of my pocket into the depths of the rental car, never to be seen by me again.  So, I told her, “Oh, I’m sorry, I don’t have a nickel, but I do have a dime.”

As I handed her the dime, I saw her face morph from a confident smirk to a confused, almost terrified look of despair .  I had just taken her from a mathematical point of “Yeah, I can do this math stuff.  I may not use the computer for the rest of my shift” to “Holy $#!+, what the #=|| just happened!”

I went into math teacher mode and waited patiently for her to begin breathing again.  And then I waited for her begin thinking.  She adjusted my change with my introduction of the idea of a nickel, why not a dime? After what seemed like 5 minutes (probably more to her), it was painfully obvious to all around that her anxiety in this situation was taking over her ability to tackle this problem. So, I tried to think of a “least helpful question” to ask.  Now I put myself on the spot.  If she only knew that we were both now feeling some of this pressure.

So, I finally asked her my question and she gave me the correct change within a few seconds.  She smiled as she gave me my change and my new “unknown” student and I parted ways.  I know I felt good about helping someone develop a strategy outside of the classroom.  I hope she had a similar feeling about learning to make sense (no pun here) of making change.

Being a math teacher is a 24-7 job sometimes and we can find our students anywhere – even in a fast food restaurant in New Mexico!

What you would have asked the cashier in this situation.  I’d love to hear what your “least helpful” question would have been. No pressure, take as long as you like.  No one is waiting in line behind you!

Feed the hungry!

Oh, here’s my question:  “If you could change the dime into some other coins, what would you change it for?”

Connecting Percents and Fractions

Not understanding mathematics can be extremely frustrating for students.  As a teacher, figuring out how to help students understand mathematics can be just as frustrating.  My primary go-to resource for these situations is Teaching Student-Centered Mathematics, by John Van de Walle et. al.  because it’s all about focusing on big ideas and helping students make sense of the math they’re learning in a conceptual way.

Recently, I was asked to model a lesson for a 6th grade class who was having difficulty working with percents.  So, I turned to my go-to resource, and during planning, I realized that I didn’t know anything about these students other than that they were struggling with percents.  So, I couldn’t assume anything.  I ended up creating three separate lessons and combined them into 1.

First, I handed groups of students a set of Percent Cards and Circle Graph Cards.  Their task was to match the percent with the corresponding circle graph.  As students were working on this, I heard groups reasoning about how they were matching the cards.  Many started with benchmarks of 25%, 50%, and 75%, while others started with the smallest (10%) and matching it to the graph with the smallest wedge.  As groups finished, they were asked to find pairs, using the matches they made, that totaled 100%.  Once finished, a discussion about their process for completing these tasks revealed a solid understanding of percent as representing a part of a whole.

Now to shake their world up a bit.  I asked them to leave their cards because they would be using them again shortly.  I introduced these Percent circles and asked them what they were.  A brief discussion revealed some misconceptions.  Some students said they were fractions, others said they were wholes because nothing was shaded.  I altered my planned line of questioning to questions that eventually led to a common understanding of what fractions were and how the pictures of the fraction (percent) circles really showed wholes and parts (fractions).

Their next task was to match their cards with the equivalent fraction circle.  This was incredibly eye-opening. Groups began to notice that some percent card matches could fit with multiple fraction circles (50% could be matched with the halves, quarters, eighths, and tenths).   Thirds and eighths were the last to be matched.  But their reasoning didn’t disappoint.  One group noticed that the percents ending in .5 all belonged with the eighths because they were too small to be thirds (the other percents with decimals).

Students were eager to share their thoughts about what they learned about fraction circles and percents:

  • Fractions and percents are the same because the pieces look the same.
  • 1/4 is the same as 25% and 2/8
  • I don’t get why the eighths end in .5.
  • The percents all can be fractions.
  • 1/8 is 12.5% because it’s half of 25%

Finally, I asked students to solve a percent problem (now that they’ve all realized that fractions and percents can be used interchangeably).   I gave them the m & m problem from this set of percent problem cards.  The only direction I gave was that they had to solve the problem using some representation of the percent in the problem before they wrote any numbers.

My bag of M&M’s had 30 candies inside.  40% of the candies were brown.  How many brown candies is that?

While this was problematic at first, students looked at their fraction circles and percent cards and realized they could use four of the tenths since each tenth was the same as 10%.  Most students needed just one “least helpful” question to get on the right track:  Where do the 30 m & m’s belong in your representation?

Most groups were able to make sense and persevere to solve the problem correctly, and explain why they “shared the 30 m & m’s equally among the ten tenths in the fraction circle” and why they “only looked at four of the tenths because that’s the same as 40%.”

My beliefs that were reinforced with this lesson:

  • We can’t assume understanding from correct answers alone.  We need to listen to students reason through problematic situations.
  • Students really want to share their thinking when they realize that someone is really interested in hearing it.
  • Students crave understanding.  They really want to make sense.
  • Procedures are important, but not at the expense of understanding.
  • Empowering students by allowing them to build their own understanding and allowing them to make connections allows students to feel comfortable taking risks in problem solving.

Please take a look at Jenise Sexton’s recent blog about percents with 7th grade students for some fantastic ideas about students using number lines and double number lines to solve percent problems.  It’s SWEET!


Math Students are Bleeding Out!

Let me explain.  There’s a math epidemic (remember Ebola 2014+).  Students are bleeding out from the gashes of their misconceptions of mathematics.  The lack of teaching conceptual understanding along with sacrificed opportunities to make mathematical connections is the double edged sword.  This is an epidemic, and some teachers, school systems and educational leaders are treating it like it’s a tiny scratch, instead of the pervasive threat to mathematical achievement that it is.

Here’s a familiar scenario:  A school’s test scores come back after the spring testing season (or mid-terms).  The scores show little growth from the previous year in the area of mathematics, and any change is not in a positive direction.  The knee-jerk reaction to the valid question, “What can we do to fix this?”  is to look for programs and technology that will fix the problem.  These are the same individuals who, way back in August, looked us all in the eye and, with the greatest of sincerity, reminded us that the single most important factor determining student success is the quality of the teacher.  Not new programs.  Instead of growing the quality of teachers, we get programs that:

  • push speed over comprehension (imagine if we taught reading this way).
  • define fluency based on digits rather than efficiency, flexibility, and accuracy.
  • use technology to separate us from our students when we know that what we really need is to spend more time listening to them and creating an interactive classroom with technology as a support for this human interaction
  • are essentially Band-Aids

I often hear the phrase “back to the basics” in times like these.   I’ve heard parents, administrators, and even a few teachers say this.  I think everyone would agree that “back to the basics” should mean that students become computationally fluent.   The idea of going back to this implies that we were doing something right before.  And we all know that’s not true.  After all we have generations of adults who are not computationally fluent and/or have extreme math anxiety.  And how did that happen?

Answer 1:  Timed tests.  My sixth grade teacher called them speed tests.  We did them every day, right after lunch.  (I was never in the top 10).

Answer 2:  Algorithms memorized by students with no understanding, presented by teachers with little understanding other than from a teachers’ edition.

Answer 3:  Little or no real problem solving.  Naked computation all around.  No wonder students were turned off by mathematics!

Answer 4:  No interaction.  Math is a social activity.  If you talk to any engineer, designer, architect, mathematician, statistician, etc.  They aren’t doing their work in an office silently sitting in rows.  They’re constantly talking to one another about the mathematics they’re using.  The idea that all of us are smarter than one of us makes so much sense in the real world and it should make sense in the classroom as well.

If we went back to teaching math like we did 20-30 years ago (I think that’s what some of these folks were implying when they said “back to the basics.”  We’d still be in the same boat.  Anyone ever watch How old is the shepherd?.  That was popularized over 20 years ago and the results haven’t changed.  Going back is not an option.  Building fluency is.

So what do we need to do in math classrooms?  I have a few ideas to stop the bleeding and these are certainly not original to me.

keep calm

  1. Apply pressure to the wound. Give up on the ineffective treatment, not the patient.  Apply pressure to stop the bleeding.  Focus on tasks and activities that build number sense.  Number Talks, Math Talks, Estimation 180, Visual Patterns any or all of these can be put in place at any level.  And the best part is, students can easily be trained to begin to apply the pressure themselves.  They have the power to stop the bleeding!
  2. Close the wound. This can only happen with stitches.  And it takes time to get the hang of it.  The wound has to be closed with the thread of understanding.  We can’t understand for them, so the wound has to be closed with the help of the students.  The students create this thread as we stitch and we can’t do it without them.  How do they create this thread of understanding?  We have to stop telling so much and instead “be less helpful.”  If we tell students too much, the thread breaks.
  3. Treat any symptoms that may show up after the initial treatments above:

Symptoms

Name

Treatment

Students may begin to rely on rote procedures with no foundational understanding

Sometimes unintentionally caused by parents & other adults trying to help.

Misconceptionitis Identify the misconception(s) and re-build understandings using the CRA (Concrete Representational Abstract) model

Students are finding unreasonable solutions to tasks & problems and they often seem unaware; clueless

Unreasonableness

This is often attributed to students just not thinking enough.  Treatment should include a DAILY diet rich in estimation – prescribe www.estimation180.com

Students count (often on fingers when computing or rely on a calculator for the simplest of calculations and even then, they can get incorrect answers.

Influencia

This is often diagnosed along with unreasonableness (see above).  Its roots lie in naked computation and memorization of facts rather than allowing students to build strategies and practice those strategies until they become fluent.  First, counting strategies are the lowest level strategies.  Students need to build more efficient strategies by exercising with  investigations of number relationships through number talks, math talks, and strategy building.  Stop giving speed tests.

Students have strategies for computation, but are not applying them in problem solving situations No Solvia

Students need a heavy dose of problem solving every day.  This must involve students engaging in the Big 8 Standards for Mathematical Practice.  Problem solving tasks every day.  Hydrate often with student reasoning.  Adopt the classroom mantra: “The answer isn’t good enough.”

Begin new concepts with a problem before any formal instruction on the topic.  See what students can do before assuming what they can’t do.

I’m a teacher and I know many of you reading this are the choir that need no preaching to.  If you’re interested in saving the patient, stopping the bleeding, and raising math achievement, click on some of the links in this post.  There’s so much to learn from those smarter than me.  Also check out #MTBoS on Twitter.  Lots of math goodness from the best out there.

Click here and here to learn more about strategy development.  Great stuff from www.nzmaths.co.nz!